Guides
Reading your production curve: midday plateau, cloud, fault
17 July 2026 · SOLARSPLIT
The inverter’s app displays a curve every day, and most owners look at it during the first week and then never again. That is a pity, because this curve is the only instrument that says whether the installation is doing its job. Here is how to read it, shape by shape, and what each shape means.
The bell, the normal shape of a clear day
In fine weather, power rises from sunrise, peaks around 1 pm and falls back until sunset: a regular bell, symmetrical on a south-facing roof, shifted slightly towards the morning on an east face and towards the evening on a west face. The height of the bell depends on the season, twice as high in June as in December, and on temperature, a cold panel produces more than a hot one. If the shape is there, all is well, whatever the day’s figure.
The midday plateau, normal and intended
On many recent installations, the top of the bell is cut off flat, as if planed. It is not a fault, it is the feed-in limitation at 70% of the panel capacity that the law requires of inverters installed since 2026, or an inverter sized slightly below the panel capacity, which is a common and sensible practice. The plateau appears for two or three hours around midday on the sunniest days, and it costs less than 3% of annual energy. Our article on 70% curtailment explains why.
A plateau that appears when there is neither a limitation nor an undersized inverter, or a plateau clearly lower than the expected power, does on the other hand deserve a question to the installer.
The double hump, the east-west roof
Two peaks, one in the morning and one in the afternoon, with a slight dip at midday: that is the signature of an installation spread over two opposite roof faces. Production is more spread out than on a south-facing roof, which fits a house’s consumption better. Nothing to do, it is the expected shape.
The sawtooth, the clouds
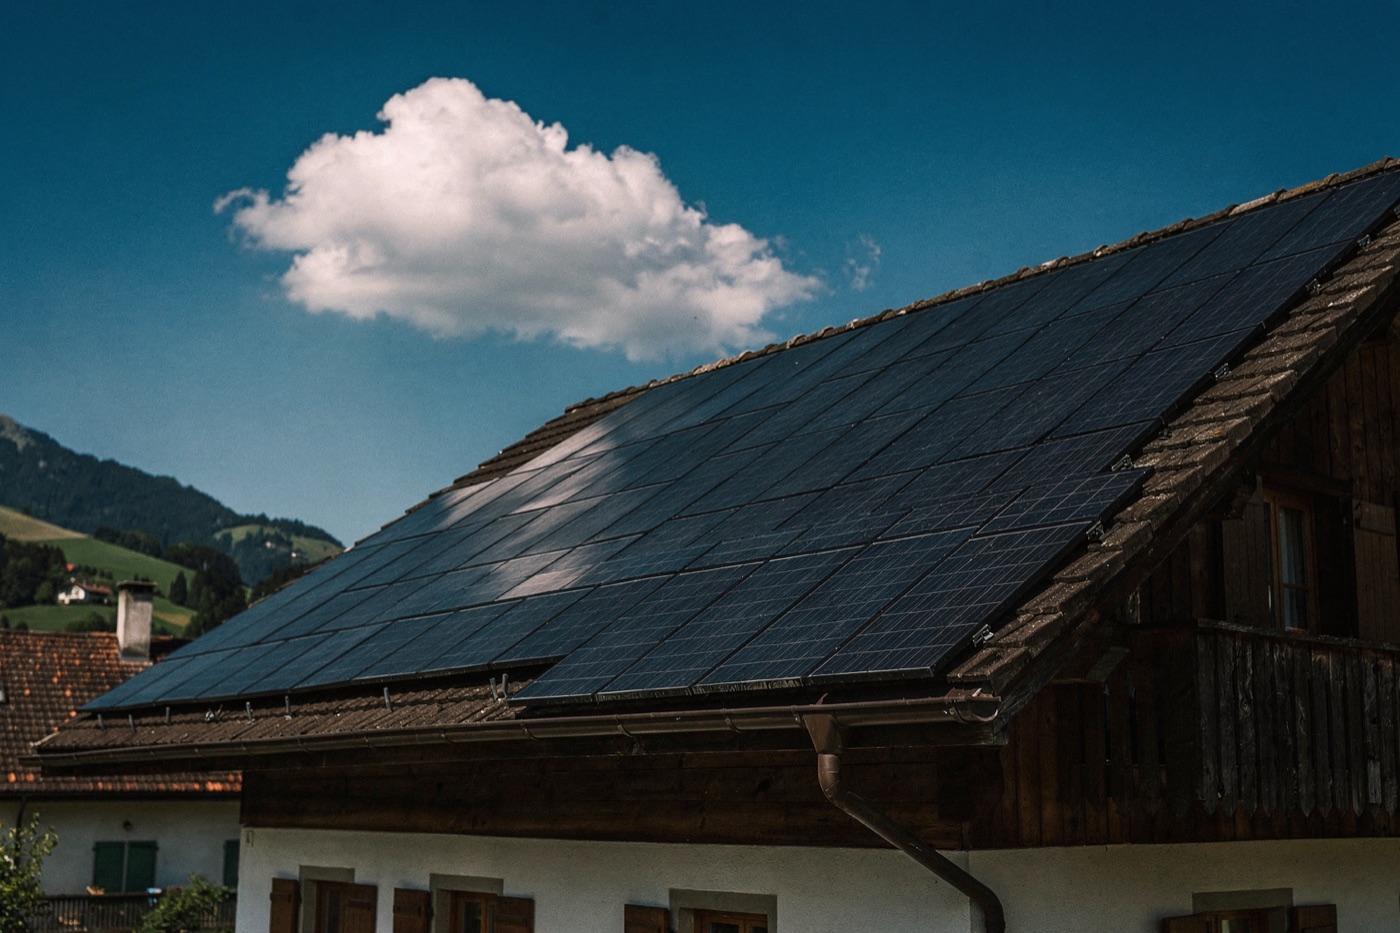
A sky of cumulus gives a jagged curve, with sharp drops and equally sharp rises, sometimes above the normal bell for a few minutes, when the sun comes out from a cloud whose edge reflects the light. That is weather, not a defect. A whole day of stratus gives, on the contrary, a low, smooth curve, at 10 or 20% of normal.
The step, the shadow
A curve that rises normally, then drops by a third or a half at the same time every day, then rises again: a shadow is passing over part of the panels. A chimney, a tree that has grown, the neighbouring building in winter when the sun is low. The time and season of the step say where the shadow comes from. On an installation without optimisers, the shadow on a single panel can pull down the whole string, which explains a disproportionate step. Our article on the signs of an underperforming installation details the case.
The zero, the outright fault
A day at zero, or a curve that stops dead in the middle of the morning and does not restart: the inverter is off, the circuit breaker has tripped, or a string of panels is disconnected. It is the easiest fault to see and the most expensive to ignore: every day of silence in summer is worth 40 to 60 kWh on a 10 kWp installation. A curve that restarts in fits and starts, with short, repeated zeros, signals an inverter that keeps dropping out, often through overheating or a grid fault, and our guide on the lifespan of an inverter says when to worry about it.
The bell too low, the slow drift
The shape is perfect but the height falls month after month compared with last year at the same period: dirt, pollen, soot deposits, snow that does not slide off, or abnormal ageing of a panel. It is the fault nobody sees by eye, because every day looks like the day before. It can only be detected with a reference.
The reference, without which you see nothing
A curve on its own does not say whether it is good. It has to be compared with what the installation should produce on that day, in that place, with that weather. That is the difference between the manufacturer’s app, which displays, and real monitoring, which compares. SOLARSPLIT monitoring calculates for each day the expected production of your roof from weather data, whatever the inverter, and alerts you when the gap persists. Our article on why monitor your production explains what it changes, and monitoring is activated from the Services page, this way.
And your roof, what is it worth?
The simulation is free and online, based on your building's public data.
Simulate my project